Watershed assessment helps identify issues or potential issues in the watershed that need to be addressed.
Watershed Health
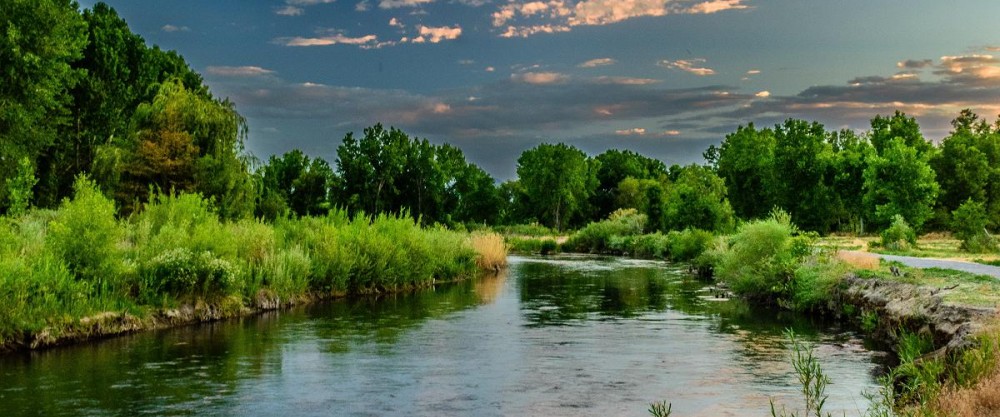
Healthy watersheds consist of multiple ecosystems that perform many ecological functions.
The broad and complex nature of inter-connectedness and interactions
within these systems makes it nearly impossible to measure watershed
health directly, or to measure every component of each ecosystem.
As such, a set of defined and easily measurable attributes or indicators that reflect the conditions of the broader ecosystem can provide information about the conditions or health and trends within a watershed.
Watershed health indicators can be a measure of a
single parameter or variable, also known as a metric (examples: water
temperature; E. coli numbers; dissolved oxygen, nitrogen, or
phosphorus concentrations), or an index that incorporates a number of
metrics or measured parameters (examples: River Water Quality Index, Alberta;
fish based Index of Biological Integrity).
Measurements are then compared to guideline values produced by government organizations and other officially recognized regulatory bodies.
The advantages of a multi-metric indicator is its ability to represent measurements of many parameters in a single number; its ability to combine numerous parameters with different measurement units in a single number; and its effectiveness as a communication tool.
Disadvantages of using an index as an indicator include: a loss of information on single variables; the loss of information on interactions between variables; and the sensitivity of the results to the formulation of the index.

In general, there are three types of indicators:
- Condition indicators — address the state of the environment, the quality and quantity of natural resources, and the state of human and ecological health. These indicators are chosen by considering biological, chemical, and physical variables and ecological functions (example: riparian health, water quality, fish community structure).
- Pressure indicators — also often referred to as stress indicators, describe natural processes and human activities that impact, stress, or pose a threat to environmental quality (example: human populations, livestock operations, water allocation, industrial activity, soil erosion, etc). Note: the existence of a pressure does not necessarily suggest that there is a negative impact, but merely the potential for one.
- Response indicators — illustrate individual and collective actions or management programs implemented to halt, mitigate, adapt to, or prevent damage to the environment (example: municipal bylaws, livestock operations regulations, education or incentive programs, watershed planning initiatives, and stewardship activities).
All three indicator types are closely related. For example, the stress of a particular pollutant entering a system may cause a change in the condition of some species (population decline) which may in turn cause a response of restrictions on the discharge of the pollutant. The additional restrictions reduce the stress which improves the condition. Condition and pressure indicators are predominantly used in assessing the state of a watershed. Response indicators are more commonly used to identify the various efforts being undertaken to address known environmental concerns.
Indicators may be further categorized according to the watershed element they represent (water quality, watershed hydrology, landscape, biological community). This categorization often assists in communicating the relationship between the indicator and conditions within the watershed.
Another tool in monitoring the health of a watershed is to calculate the flow rates of its various streams.
River flows can be highly variable, and are affected by natural changes in climate and seasonal weather patterns, as well as by human use and management of water, including dams and other infrastructure (such as weirs and canals).
River flow regimes are examined by Alberta Environment on a two-season basis:
- Summer considered as one season (from May to September)
- Late Fall to early Spring (from October to April) – considered the other season.
An annual assessment is also reported, along with a ten-year average, which is an indication of potential long-term or cumulative stresses.
As water moves within a watershed, its characteristics are influenced by both the natural environment and human activities. Key factors that influence water quantity and quality are climate, hydrology, topography, bedrock, and land use.
Water Quality
Water quality refers to the suitability of water for an intended use. Good quality water is safe for drinking, protection of aquatic life (fish and other organisms living in water), agricultural use (irrigation of crops and livestock watering), or aesthetics and recreation.
Water quality is determined by measuring a set of chemical, biological, physical, and radiological characteristics of water, and comparing these with established provincial and federal government guidelines. Guideline values depend on the intended use of the water:

SEAWA water quality publications:
- Understanding Water Quality in the SEAWA Watershed (2023) (286.02 KB)
- Water Quality of Seven Persons Creek at Two Riparian Restoration Sites (2021) (2.26 MB)
- Fishing in the SEAWA Watershed (2022) (2.55 MB)
A useful indicator of water quality is the presence or lack of various kinds of biological markers. These can include aquatic animals, plants, invertebrates, and microorganisms. The Canadian Aquatic Biomonitoring Network (CABIN) has developed methods for biomonitoring to determine water quality, and keeps a large database of relevant information.
Human activities as in land use (agriculture, urban development, industrial development, infrastructure development, forest harvest, etc.) affect surface water quality. Natural factors also affect surface water quality such as the bedrock composition, topography, and climate.
More water quality resources:
- Multiple Land Use Activities Drive Riverine Salinization in a Large Semi-Arid River Basin in Western Canada - Kerr, 2017 (930.04 KB)
- Trace Organic Compounds in Rivers, Streams, and Wastewater in Southeastern Alberta, Canada - Basiuk et al, 2019 (1.46 MB)
- From Peaks to Prairies: A Time-of-Travel Synoptic Survey of Pesticides in Watersheds of Southern Alberta, Canada - Sheedy et al, 2019 (1.89 MB)


Water Quantity
Water management must balance and allocate water resources to meet crucial but competing needs for healthy aquatic ecosystems, drinking water and other human domestic uses, and economic activities. In the face of climate change, meeting these needs become challenging especially with the predicted increased frequency of extreme events such as flooding and drought. Studies have been started by experts to potentially provide solutions towards adaptation to climate change:
An important factor in the health of a watershed is that water is available to support all the activities carried out within the watershed, whether natural or human. Human water use in the SEAWA watershed is in part regulated by an agreement between the provinces of Alberta, Saskatchewan, and Manitoba, that apportions water from any cross-boundary water bodies, and their tributaries. This is called the Master Agreement on Apportionment.
For data on river flows, water quality, water resource advisories, and flood hazard mapping visit:
Further resources include:
-
Canada in a Changing Climate: Regional Perspectives Report - Natural Resources Canada, Ongoing
- Diagnosis of future changes in hydrology for a Canadian Rocky Mountain headwater basin - Fang and Pomeroy, 2020
- Changes to flood peaks of a mountain river: implications for analysis of the 2013 flood in the Upper Bow River, Canada - Whitfield and Pomeroy, 2016
- Hydrological resilience of a Canadian Rockies headwaters basin subject to changing climate, extreme weather, and forest management - Harder et al, 2015
- New reconstructions of streamflow variability in the South Saskatchewan River Basin from a network of tree ring chronologies, Alberta, Canada - Axelson et al, 2009
- South Saskatchewan River Basin in Alberta Water Supply Study - AMEC Earth and Environmental, 2009
Riparian Health Assessment
Riparian health can be assessed using the Cows and Fish method, which provides ratings of healthy (good), healthy with problems (fair), and unhealthy (poor). Separate methods exist for streams and rivers, as well as for lakes and ponds.
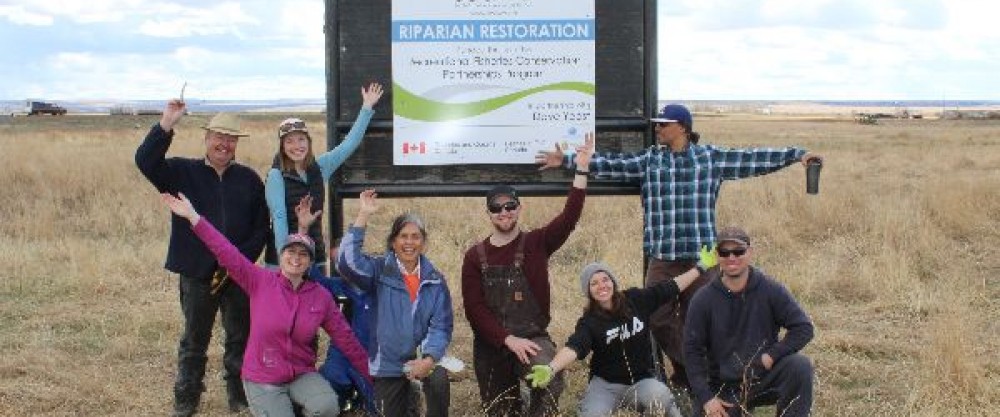
We have assessed 702 km of riparian areas in the Seven Persons Creek watershed. Details are found in this report:
- Aerial Assessment of Riparian Areas in the Seven Persons Creek Watershed - Summary (1.66 MB)
- Aerial Assessment of Riparian Areas in the Seven Persons Creek Watershed - Full Report (59.32 MB)
- Riparian Health Assessment 2015 - 2016 - South Saskatchewan River at Medicine Hat, Alberta. (3.05 MB)